CHAPTER 3 IMAGES: FUNGAL STRUCTURE AND ULTRASTRUCTURE
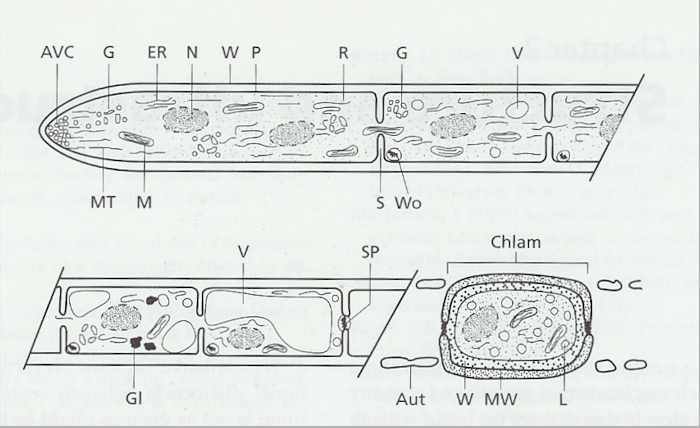
Fig 3.1 Diagrammatic representation of a fungal hypha, showing progressive ageing and vacuolation behind the hyphal tip. In the oldest regions, the walls may break down by autolysis or the mycelial nutrients may accumulate in chlamydospores (thick-walled resting spores that serve in dormant survival. AVC = apical vesicle cluster; G = golgi/golgi equivalent; Gl = glycogen; MT = microtubules; M = mitochondria; ER = endoplasmic reticulum; N = nucleus; P = plasmalemma; W = wall; Wo = Woronin body; S = septum; R = ribosomes; V = vacuole; SP = septal plug; Aut = autolysis; CHLAM = chlamydospore; MW = melanised wall; L = lipid. [© Jim Deacon]
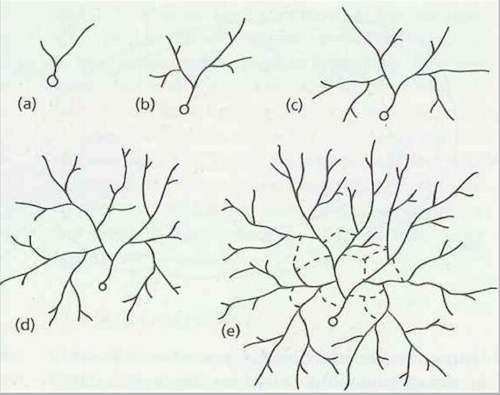
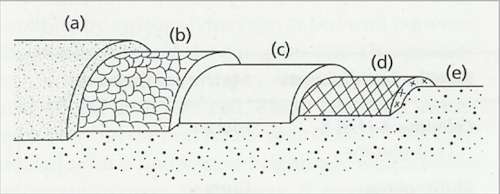
Fig 3.5 Stages in the development of a fungal colony from a germinating spore. The broken lines in (e) represent narrow anastomosing hyphae near the centre of the colony. [© Jim Deacon]
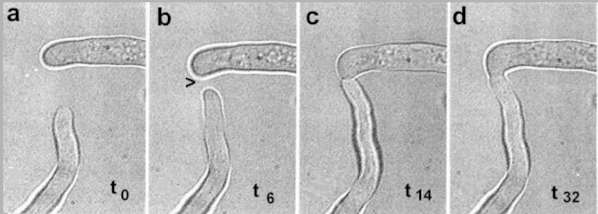
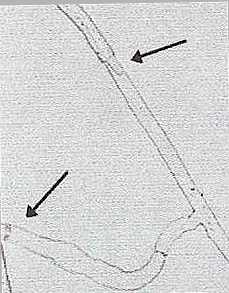
Fig 3.6a Videotaped sequence of anastomosis (successful hyphal fusion) of two compatible hyphae of Rhizoctonia solani. The times shown are minutes after the start of recording. The upper hypha had stopped growing at t0 but began to produce a branch (arrowhead) at t6 in response to the approaching hyphal tip. The hyphal tips met at t14. Dissolution of the tip walls and complete hyphal fusion was achieved at t32. If you want to use this image, or those below, please cite the source as [Courtesy of P. McCabe, M.P.Gallagher & J.W.Deacon, The University of Edinburgh]
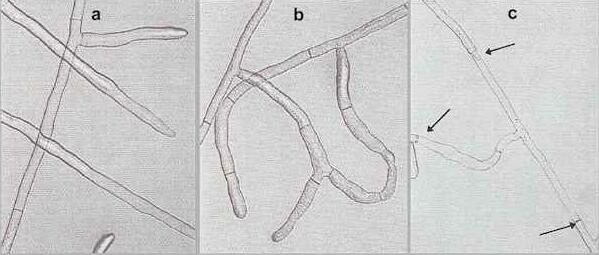
Fig 3.6b Three different patterns of response between hyphae of Rhizoctonia solani. (a) Neutral response, where the hyphae of different anastomosis groups do not recognise one another. (b) Hyphae belonging to a single vegetative compatibility group are attracted to one another and fuse by tip-to-tip contact, creating a network with cytoplasmic continuity. (c) Hyphae of two different vegetative compatibility groups fuse with one another, but this is followed by cytoplasmic death of the fused hyphae (the region shown by arrows).
Fig 3.6c Detail of the interaction shown in (c) above: a hyphal tip has grown from a septum into the hyphae that were killed by the incompatibility reaction.
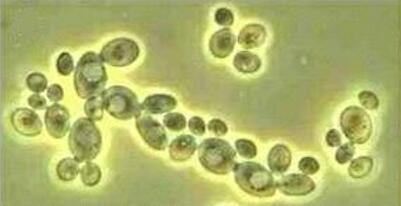
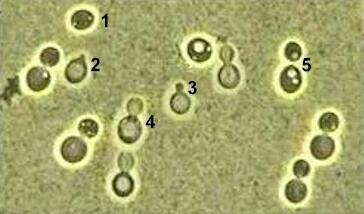
Fig. 3.7. Left: the common budding yeast, Saccharomyces cerevisiae, viewed by phase-contrast microscopy. Right: Cryptococcus albidus, a yeast that produces a rigid polysaccharide capsule over the cell surface, seen by mounting the cells in a suspension of India ink particles. Different stages in the budding process are labelled from 1 (non-budding cell) to 5 (cell separation). Note the presence of phase-bright lipid bodies in the plane of focus of some cells (e.g. 5) and the presence of a large central vacuole in the plane of focus of some other cells (e.g. 2, 3, 4). [© Jim Deacon]
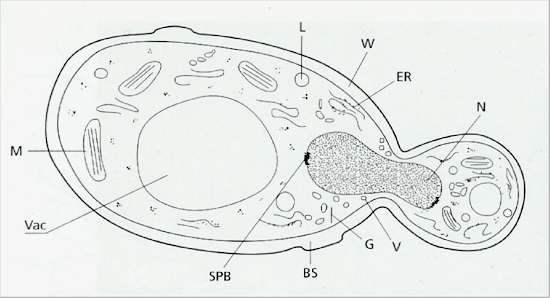
Fig. 3.8. Diagrammatic representation of a budding yeast, Saccharomyces cerevisiae, about 5µm diameter. BS = bud scar; ER = endoplasmic reticulum; G = Golgi; L = lipid body; M = mitochondrion; N = nucleus; SPB = spindle-pole body; V = vesicle; Vac = large central vacuole; W = wall. [© Jim Deacon]
Fig. 3.9. Diagram to illustrate the wall architecture in a ‘mature’ (subapical) region of a hypha of Neurospora crassa as evidenced by sequential enzymatic digestion. (a) Outermost layer of amorphous ß-1,3-glucans and ß-1,6-glucans. (b) glycoprotein reticulum embedded in protein. (c) a more or less discrete protein layer, (d) chitin microfibrils embedded in protein, (e) plasma membrane. Based on Hunsley & Burnett, 1970. [© Jim Deacon] |
||||||||||||