..
CHAPTER 5 IMAGES: DIFFERENTIATION AND DEVELOPMENT
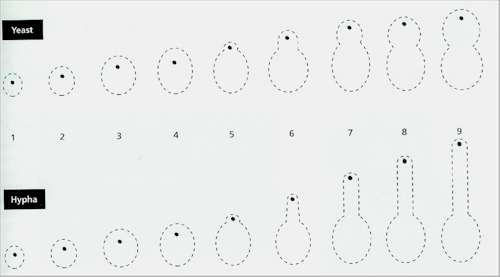
Fig. 5.1. Computer simulation of dimorphism in Candida albicans, based on the assumption that wall growth occurs by bombardment of the wall by apical vesicles generated from a vesicle-supply centre (VSC, black dot). The yeast (top series) and hyphal shapes (lower series) were ‘grown’ simultaneously at the same rate (10,000 vesicles per frame). Each frame indicates a unit of time. The VSC was moved at different rates to generate the shapes. Between frames 4 and 5 the speed of VSC movement was increased 4-fold to produce a cell outgrowth. Then it was returned to its previous rate to produce the yeast bud, but continued at a 4-fold rate to generate the hypha. [Based on work by S.Bartnicki-Garcia, D.D.Bartnicki & G. Gierz (1993). Canadian Journal of Botany 73, S372-378.]
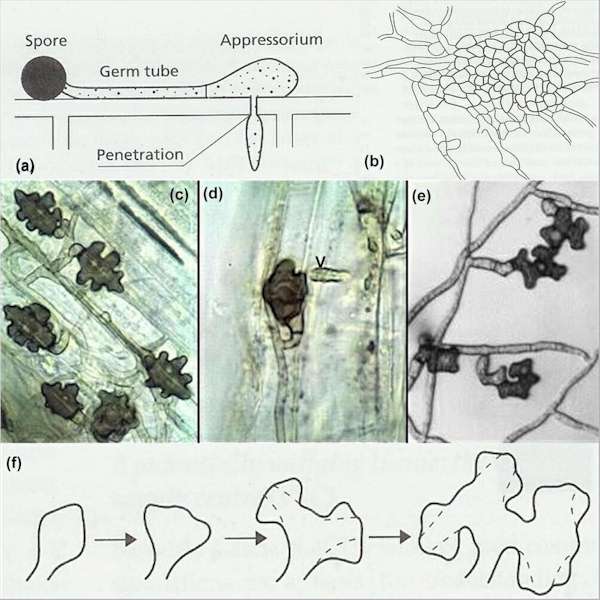
Fig. 5.2. Examples of infection structures of plant-pathogenic fungi. (a) Diagrammatic representation of an appressorium produced from a germinating spore. A narrow penetration peg develops from beneath the appressorium, to breach the host cell wall, and then expands to produce an infection hypha. (b) An infection cushion composed of a tissue-like mass of melanised hyphae, from which multiple penetration pegs invade the host plant. (c-e) Lobed hyphopodia of one of the take-all fungi (Gaeumannomyces graminis var. graminis) growing on a cereal stem base. Fig. (c) shows these structures in surface view, whereas Fig. (d) shows a hyphopodium in side view. The arrowhead in Fig. (d) is a papilla (a localised ingrowth of the wall of the plant cell that the fungus is attempting to penetrate) signifying that the plant cell is still alive and resisting invasion. Fig. (e) shows lobed hyphopodia of G. graminis produced on the plastic base of a Petri dish. Fig. (f) shows the hypothesised mode of development of lobed hyphopodia by repeated stoppage, swelling and branching of a hyphal tip. [© Jim Deacon]
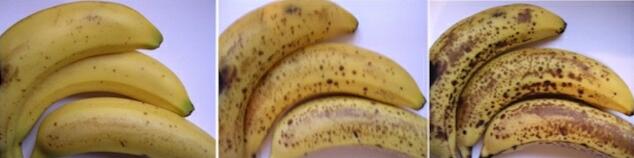
Fig. 5.3. Bananas infected by Colletotrichum musae, photographed over a 10-day period after the fruit ripened. Small brown flecks on the fruit surface (left) result from the activation of single-celled, melanised appressoria that remained dormant for several months. When the fruit begins to ripen at the transitional phase termed the "climacteric", the lesions rapidly expand and coalesce, leading to softening and over-ripening of the fruit tissues. [© Jim Deacon]
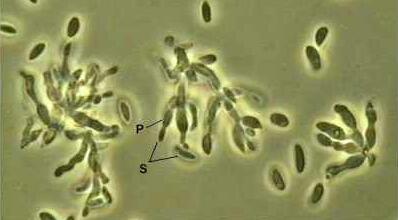
Fig. 5.4. Dense clusters of flask-shaped phialides (P) and spores (S) of Colletotrichum musae scraped from the surface of a ripe banana. [© Jim Deacon]
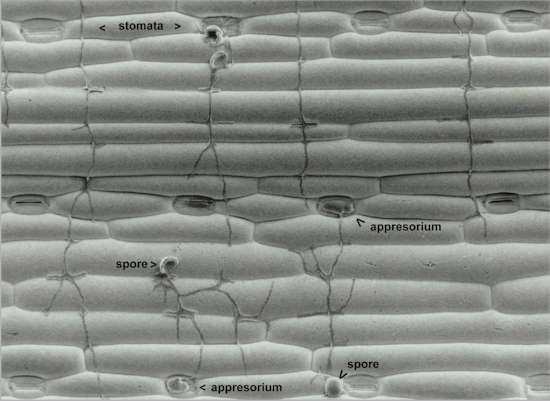
Fig. 5.5. Scanning electron micrograph showing directional growth of hyphae arising from uredospores of Puccinia graminis on an inert replica of the lower surface of a wheat leaf. Note the perpendicular alignment of the hyphae to the contours of the leaf replica, and the short lateral branches that arise in the grooves. The hyphae arising from two spores have located the ‘stomata’ on the leaf replica and produced appressoria directly over the stomatal pores. [Image reproduced by courtesy of N.D.Read, L.J.Kellock, H.Knight & A.J.Trewavas; pp. 137-172 in: Perspectives in Plant Cell Recognition (eds J.A.Callow & J.R.Green) Cambridge University Press, 1992.]
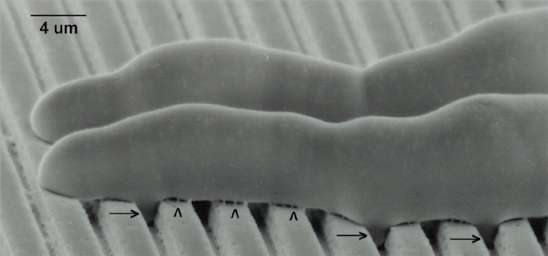
Fig. 5.6. Scanning electron micrograph of two hyphae of Puccinia graminis growing perpendicularly over the ridges and grooves of a polystyrene replica of a microfabricated silicon wafer. The germ-tube tips have a ‘nose-down’ orientation which might facilitate topographical sensing. Arrowheads indicate the dried remains of mucilage that adhered the germ-tubes to the surface. Although it is not clearly shown in this image, the hyphae also form projections that grow into the grooves (arrows), equivalent to the short lateral branches shown in Fig. 4.6. [Image reproduced by courtesy of N.D.Read, L.J.Kellock, H.Knight & A.J.Trewavas; pp. 137-172 in: Perspectives in Plant Cell Recognition (eds J.A.Callow & J.R.Green) Cambridge University Press, 1992.]
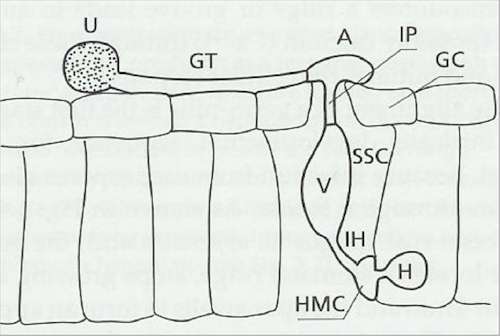
Fig. 5.7. Infection structures of the bean rust fungus, Uromyces appendiculatus, penetrating a stomatal opening from a germinating uredospore. U = uredospore; GT = germ-tube; A = appressorium; GC = stomatal guard cell; IP = infection peg; V = sub-stomatal vesicle; SSC = sub-stomatal cavity; IH = infection hypha; HMC = haustorial mother cell; H = haustorium. [Based on a diagram in H.C.Hoch, R.C.Staples, B.Whitehead, J.Comeau & E.D.Wolfe (1987); Signalling for growth orientation and differentiation by surface topography in Uromyces. Science 235, 1659-1662.]
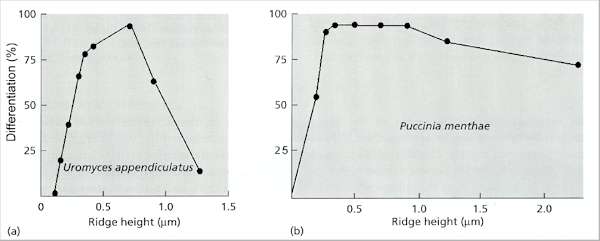
Fig. 5.8. Production of appressoria by two rust fungi in response to single ridges of different heights on polystyrene replicas of microfabricated silicon wafers. (a) Uromyces appendiculatus responded only to ridges of narrowly defined height. (b) Puccinia menthae responded to all ridges above a minimum height. [Based on work by E.A.Allen, B.A.Hazen, H.C.Hoch et al. (1991) Phytopathology 81, 323-331].
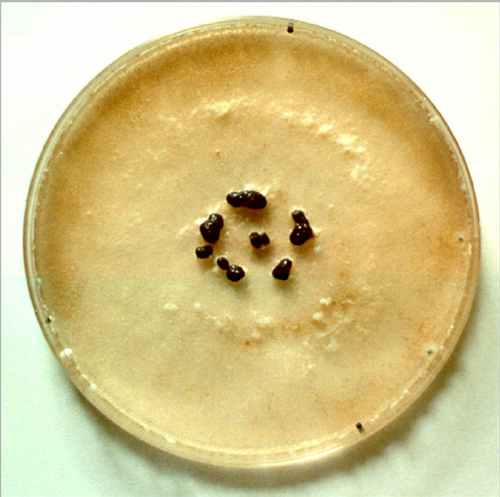
Fig 5.9a Colony of Sclerotinia sclerotiorum that has produced a ring of sclerotia (specialised multicellular dormant survival bodies) on an agar plate. [© Jim Deacon]
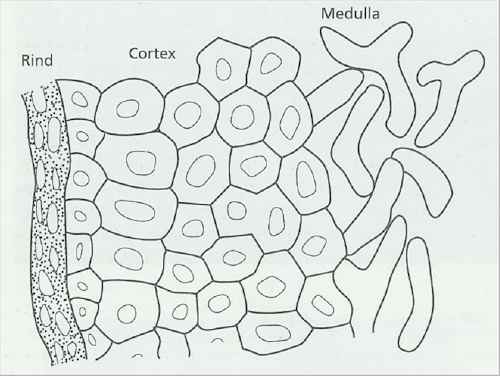
Fig 5.9b Diagram of part of a cross section of a sclerotium of Athelia rolfsii, showing a crushed, melanised rind, a tissue-like cortex of thick-walled cells and a central medulla of normal hyphae. [© Jim Deacon] |
|||||||||||