..
MORE IMAGES FROM CHAPTER 11: FUNGAL ECOLOGY - SAPROTROPHS
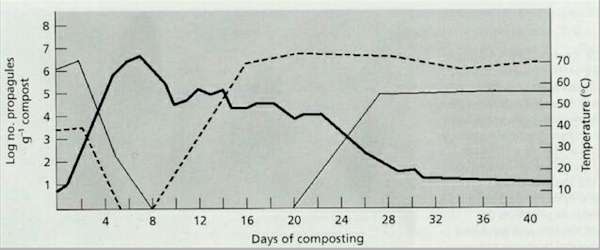
Fig 11.11 Changes in temperature (thick line), populations of mesophilic fungi (broken line) and populations of thermophilic fungi (narrow line) in a wheat straw compost. (Based on Chang & Hudson, 1967)
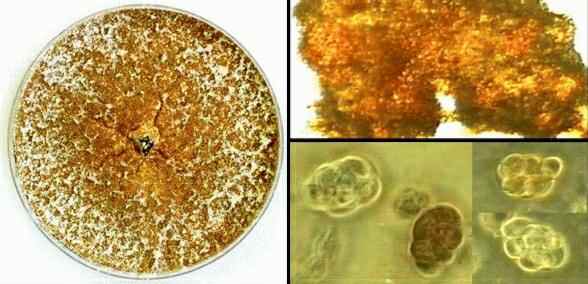
Fig 11.12 Thermoascus aurantiacus produces a thick, crusty, golden-brown colony on agar. The crusty appearance is due to the presence of many cleistothecia (closed ascocarps) which contain asci. Within each ascus is a cluster of 8 ascospores, shown in different stages of maturity (bottom right). [© Jim Deacon]
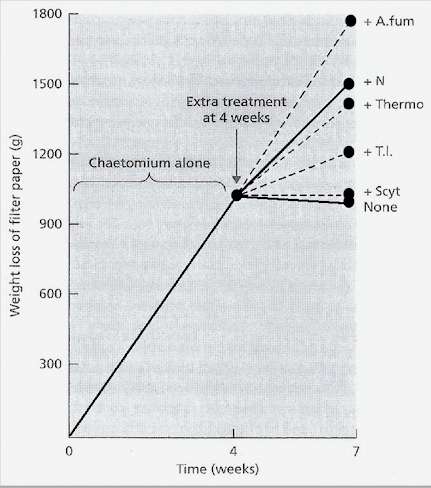
Fig 11.13 A laboratory experiment simulating a succession of thermophilic fungi growing on cellulose (Deacon, 1985; see text for details). Scyt = Scytalidium thermophilum; T.l. = Thermomyces lanuginosus; Thermo = Thermoascus aurantiacus; A. fum = Aspergillus fumigatus; N = nitrogen. [© Jim Deacon]
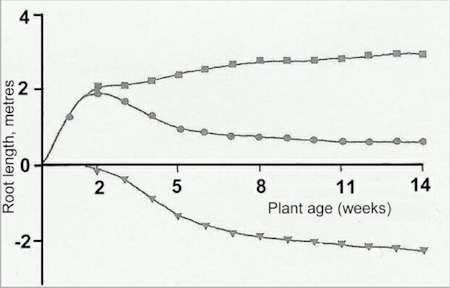
Fig 11.14 Cumulative root production (square symbols), cumulative root decay (triangles) and white living roots (circles) of groundnut plants grown for 14 weeks (near-maturity). Nearly identical results were obtained for 5 different groundnut cultivars (2 replicates of each). [© U. Krauss & J.W.Deacon, 1994]
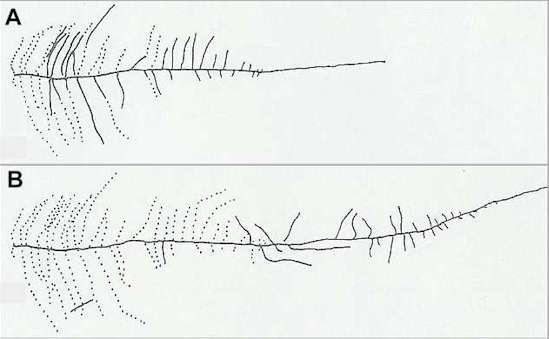
Fig 11.15 Representative tracings of the root system of a single groundnut plant. Root distribution was traced onto a transparent overlay at weekly intervals, but only the tracings at 6 weeks (A) and 13 weeks (B) are shown. Solid lines represent roots that were white (alive) at the times of these tracings. Broken lines represent roots that were present earlier but had decayed and disappeared. Nearly identical results were found for 5 groundnut cultivars (2 replicates of each). [© U. Krauss & J.W.Deacon, 1994]
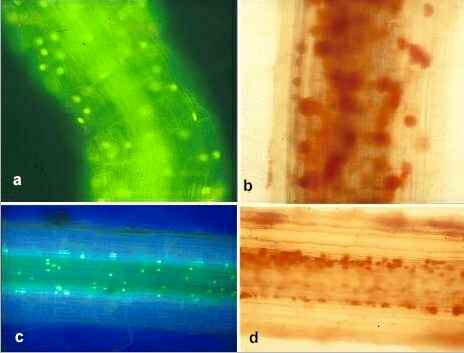
Fig 11.16 Natural (non-pathogenic) cortical cell death in soil-grown wheat roots stained with acridine orange (a, c) or neutral red (b,d). All the cortical cell layers are alive in (a) and most layers are alive in (b). The outer 5 (of a total 6) cell layers have died in the older root regions (c and d) but the innermost (sixth) layer always remains alive until the root itself dies. [© D. Lascaris & Jim Deacon, 1991]
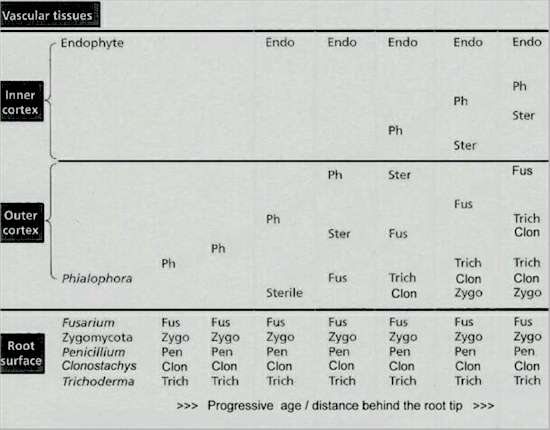
Fig 11.17 The sequence of fungal invasion of ryegrass roots, with increasing age and distance behind the extending root tips. Based on Waid (1957) but with additional information and interpretation. Phialophora graminicola (Ph), a weak parasite, initiates the invasion sequence as the root cortex starts to senesce. Subsequent invaders include a sterile hyaline fungus (Ster), Fusarium culmorum (Fus) and then a suite of saprotrophic fungi, including Zygomycota (Zygo), Clonostachys rosea (Clon) and Trichoderma (Trich). [© Jim Deacon]
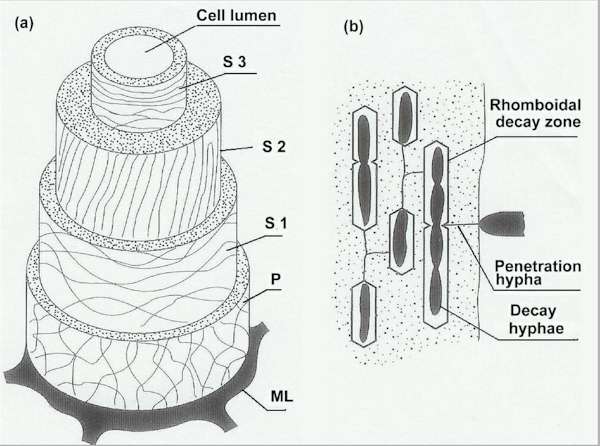
Fig 11.18 (a) Diagram of the cell wall layers in woody tissue, showing the arrangement of cellulose microfibrils. ML = middle lamella between adjacent woody cells; P = thin primary wall with loosely and irregularly arranged microfibrils; S1-S3 = secondary wall layers. (b) Characteristic decay pattern of a soft-rot fungus in the S2 layer. The fungus penetrates by narrow hyphae, then forms broader hyphae in planes of weakness in the wall, and these hyphae produce rhomboidal cavities where the cellulose has been enzymatically degraded. |
|||||||||||